Logtivity allows you to show your data in a chart format. After you create the charts, they will update automatically when new data is added.
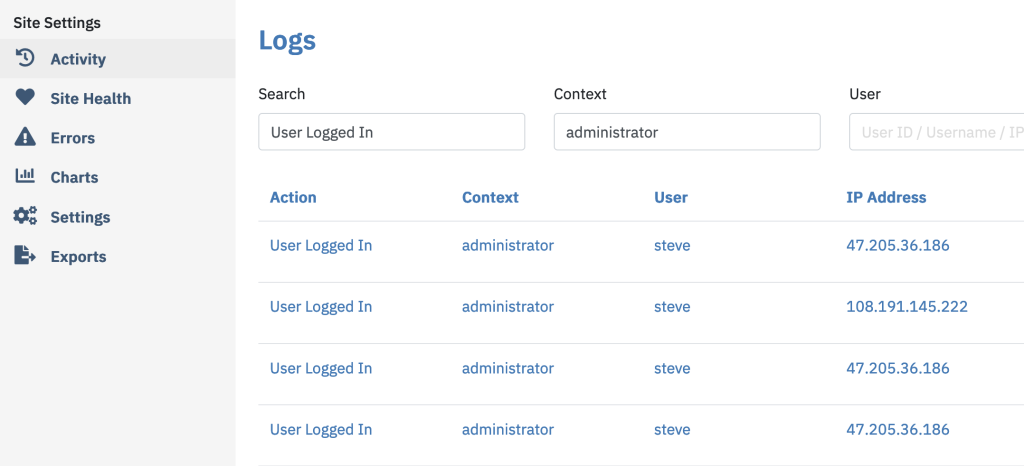
Start by visiting the “Logs” screen. Here you can search for an “Action” and/or a “Context”. In the example below, my search will show every time that a user in the “Administrator” role logged in:
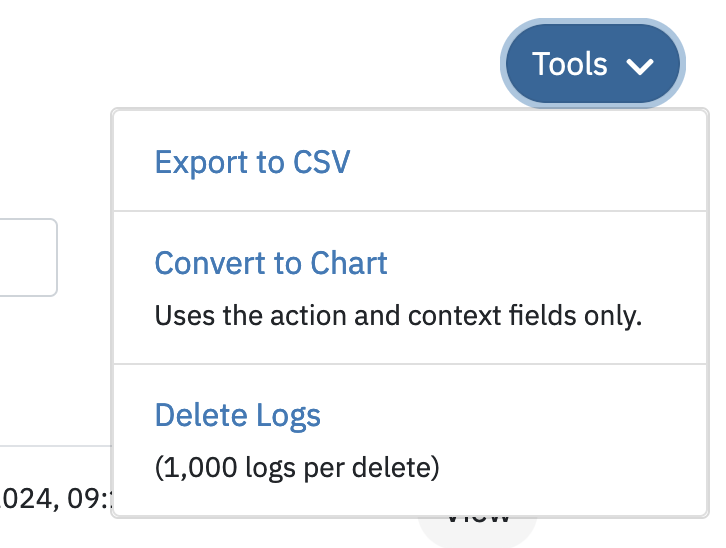
After you have made your search, click the “Actions” button and then “Convert to Chart”:
- You can choose to create a “Bar Chart” or “Line Chart”:
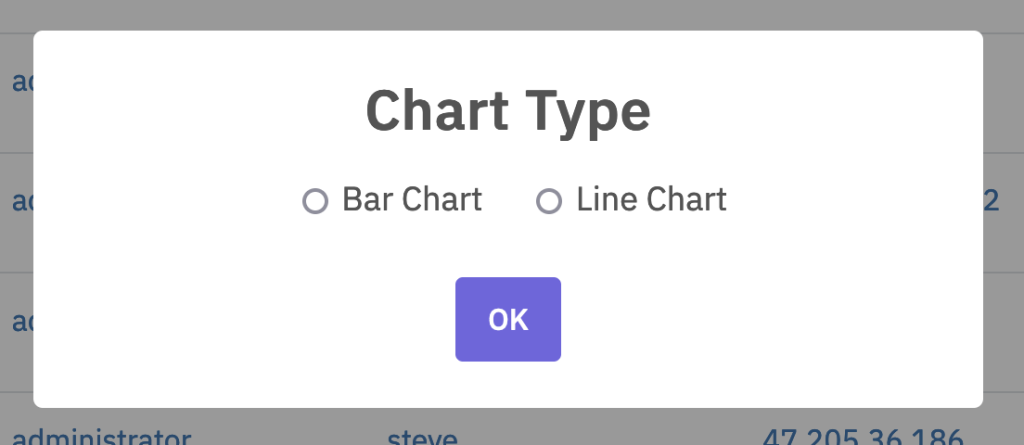
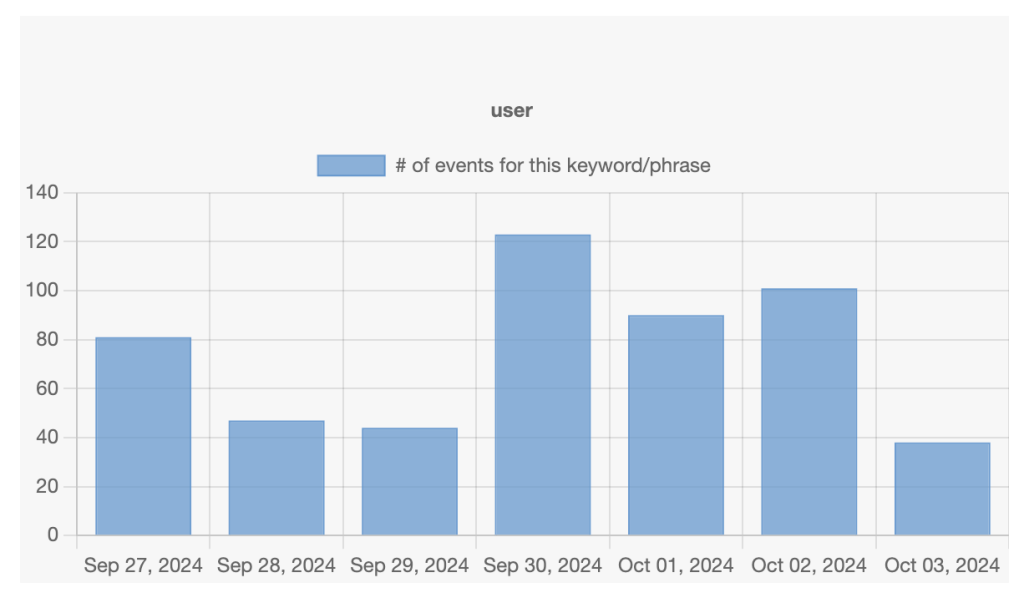
- Click “OK” and your chart will appear on the “Site Dashboard” screen: